こんにちは。
古いラズパイにマインクラフトサーバーをやらせたりして遊んでいると、すぐに CPUが 100%に張り付いたりメモリが足りなくなったりなど、サーバーとしてのリソース枯渇にすぐに直面します。
こういうギリで動いているサーバーは監視対象としては格好の的なので、これまでを応用して Prometheusでサーバーメトリクスを取得してみようと思います。
「Prometheusインストール」と、「Grafanaでカッコイイグラフを作る」の応用でになります。
対象のラズパイは「Raspberry Pi リブート」で作ったやつです。
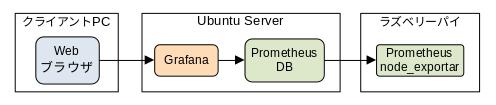
各々の関係はこのような感じです。
今回監視する方のサーバーの方のセットは以下のバージョンでやりますが、導入手順は上のものと同じでしょう。
一通り 2022年11月7日での最新版を使います。
- Ubuntu Server 22.04.1
- Prometheus 2.39.1 (RCではないものを選びました)
- Grafana 9.2.3
Prometheusをダウンロードします。
subro@UbuntuServer2204:~$ curl -sOL https://github.com/prometheus/prometheus/releases/download/v2.39.1/prometheus-2.39.1.linux-amd64.tar.gz

subro@UbuntuServer2204:~$ ls -l prometheus-2.39.1.linux-amd64.tar.gz
-rw-rw-r-- 1 subro subro 86239200 11月  7 10:10 prometheus-2.39.1.linux-amd64.tar.gz
ダウンロードできました。
私の好みで、Prometheusを実行する専用ユーザー/グループ「promet」を作ります。
subro@UbuntuServer2204:~$ sudo adduser promet
ユーザー `promet' を追加しています...
新しいグループ `promet' (1002) を追加しています...
新しいユーザー `promet' (1002) をグループ `promet' に追加しています...
ホームディレクトリ `/home/promet' を作成しています...
`/etc/skel' からファイルをコピーしています...
新しい パスワード: prometユーザーの新規パスワード
新しい パスワードを再入力してください: パスワードをもう一回
passwd: パスワードは正しく更新されました
promet のユーザ情報を変更中
新しい値を入力してください。標準設定値を使うならリターンを押してください
        フルネーム []: Enterキー
        部屋番号 []: Enterキー
        職場電話番号 []: Enterキー
        自宅電話番号 []: Enterキー
        その他 []: Enterキー
以上で正しいですか? [Y/n] Y
専用ユーザー/グループができました。
ファイルを展開します。
tarコマンド(an archiving utility)の -C オプションで展開先のディレクトリを指定できます。
subro@UbuntuServer2204:~$ sudo tar -xzvf prometheus-2.39.1.linux-amd64.tar.gz -C /usr/local/share
prometheus-2.39.1.linux-amd64/
prometheus-2.39.1.linux-amd64/NOTICE
prometheus-2.39.1.linux-amd64/consoles/
prometheus-2.39.1.linux-amd64/consoles/node-overview.html
prometheus-2.39.1.linux-amd64/consoles/node-cpu.html
prometheus-2.39.1.linux-amd64/consoles/prometheus-overview.html
prometheus-2.39.1.linux-amd64/consoles/prometheus.html
prometheus-2.39.1.linux-amd64/consoles/index.html.example
prometheus-2.39.1.linux-amd64/consoles/node.html
prometheus-2.39.1.linux-amd64/consoles/node-disk.html
prometheus-2.39.1.linux-amd64/promtool
prometheus-2.39.1.linux-amd64/LICENSE
prometheus-2.39.1.linux-amd64/prometheus.yml
prometheus-2.39.1.linux-amd64/console_libraries/
prometheus-2.39.1.linux-amd64/console_libraries/prom.lib
prometheus-2.39.1.linux-amd64/console_libraries/menu.lib
prometheus-2.39.1.linux-amd64/prometheus
展開できました。
出来上がったディレクトリ以下をすべて prometユーザー/グループのものに変えておきます。
subro@UbuntuServer2204:~$ sudo chown -R promet:promet /usr/local/share/prometheus-2.39.1.linux-amd64

subro@UbuntuServer2204:~$ ls -ld /usr/local/share/prometheus-2.39.1.linux-amd64
drwxr-xr-x 4 promet promet 4096 10月  8 01:28 /usr/local/share/prometheus-2.39.1.linux-amd64
変わりました。
起動時に systemdで自動起動するよう、ユニットファイルを以下の内容で作りました。
subro@UbuntuServer2204:~$ cat /etc/systemd/system/prometheus.service
[Unit]
Description=Prometheus
After=network.target

[Service]
Type=simple
ExecStart=/usr/local/share/prometheus-2.39.1.linux-amd64/prometheus --config.file=prometheus.yml
Restart=always
# Consider creating a dedicated user for Wiki.js here:
User=promet
#Environment=
WorkingDirectory=/usr/local/share/prometheus-2.39.1.linux-amd64

[Install]
WantedBy=multi-user.target
このユニットを有効化します。
subro@UbuntuServer2204:~$ sudo systemctl enable prometheus.service
Created symlink /etc/systemd/system/multi-user.target.wants/prometheus.service → /etc/systemd/system/prometheus.service.
Prometheusのサービスを開始します。
subro@UbuntuServer2204:~$ sudo systemctl start prometheus.service

subro@UbuntuServer2204:~$ sudo systemctl status prometheus.service
● prometheus.service - Prometheus
     Loaded: loaded (/etc/systemd/system/prometheus.service; enabled; vendor preset: enabled)
     Active: active (running) since Mon 2022-11-07 12:16:40 JST; 10s ago
   Main PID: 1889 (prometheus)
      Tasks: 9 (limit: 9365)
     Memory: 16.1M
        CPU: 112ms
     CGroup: /system.slice/prometheus.service
             └─1889 /usr/local/share/prometheus-2.39.1.linux-amd64/prometheus --config.file=prometheus.yml

11月 07 12:16:40 UbuntuServer2204 prometheus[1889]: ts=2022-11-07T03:16:40.812Z caller=head.go:595 level=info component=tsdb msg="On-disk memory mappable chunks replay completed" duration=3.993µs
11月 07 12:16:40 UbuntuServer2204 prometheus[1889]: ts=2022-11-07T03:16:40.812Z caller=head.go:601 level=info component=tsdb msg="Replaying WAL, this may take a while"
11月 07 12:16:40 UbuntuServer2204 prometheus[1889]: ts=2022-11-07T03:16:40.814Z caller=head.go:672 level=info component=tsdb msg="WAL segment loaded" segment=0 maxSegment=0
11月 07 12:16:40 UbuntuServer2204 prometheus[1889]: ts=2022-11-07T03:16:40.814Z caller=head.go:709 level=info component=tsdb msg="WAL replay completed" checkpoint_replay_duration=53.93µs wal_repl>
11月 07 12:16:40 UbuntuServer2204 prometheus[1889]: ts=2022-11-07T03:16:40.823Z caller=main.go:1001 level=info fs_type=EXT4_SUPER_MAGIC
11月 07 12:16:40 UbuntuServer2204 prometheus[1889]: ts=2022-11-07T03:16:40.824Z caller=main.go:1004 level=info msg="TSDB started"
11月 07 12:16:40 UbuntuServer2204 prometheus[1889]: ts=2022-11-07T03:16:40.824Z caller=main.go:1184 level=info msg="Loading configuration file" filename=prometheus.yml
11月 07 12:16:40 UbuntuServer2204 prometheus[1889]: ts=2022-11-07T03:16:40.825Z caller=main.go:1221 level=info msg="Completed loading of configuration file" filename=prometheus.yml totalDuration=>
11月 07 12:16:40 UbuntuServer2204 prometheus[1889]: ts=2022-11-07T03:16:40.825Z caller=main.go:965 level=info msg="Server is ready to receive web requests."
11月 07 12:16:40 UbuntuServer2204 prometheus[1889]: ts=2022-11-07T03:16:40.825Z caller=manager.go:943 level=info component="rule manager" msg="Starting rule manager..."
上手く立ち上がっているようです。
これで Prometheusは良さげです。
ラズパイに Prometheusの Linux用 node_exporterをインストールします。
最新版からはちょっと遅れるようですが、Raspberry Pi OSの aptリポジトリにありますので、それをインストールしましょう。
subro@raspberrypi:~ $ sudo apt install -y prometheus-node-exporter-collectors
パッケージリストを読み込んでいます... 完了
依存関係ツリーを作成しています... 完了

〜〜〜 中略 〜〜〜

Created symlink /etc/systemd/system/timers.target.wants/prometheus-node-exporter-smartmon.timer → /lib/systemd/system/prometheus-node-exporter-smartmon.timer.
man-db (2.9.4-2) のトリガを処理しています ...
インストールできました。
2022年11月7日では、1.1.2になりました。
Prometheusの監視対象に、ラズパイを入れます。
Prometheusの設定ファイルに追記をしますが、上で作った環境での設定ファイルは、
/usr/local/share/prometheus-2.39.1.linux-amd64/prometheus.yml
になります。
「- job_name: "prometheus"」項目の下にジョブを追加しましょう。
  - job_name: "prometheus"

    # metrics_path defaults to '/metrics'
    # scheme defaults to 'http'.

    static_configs:
      - targets: ["localhost:9090"]

 ↓ ↓ ↓ ↓ ↓ ↓ ↓ ↓ ↓ ↓ ↓ ↓ ↓

  - job_name: "prometheus"

    # metrics_path defaults to '/metrics'
    # scheme defaults to 'http'.

     style="color:pink;">static_configs:
      - targets: ["localhost:9090"]

  - job_name: "raspberrypi"

    static_configs:
      - targets: ["raspberrypi:9100"]
Prometheusを再起動します。
subro@UbuntuServer2204:~$ sudo systemctl restart prometheus.service
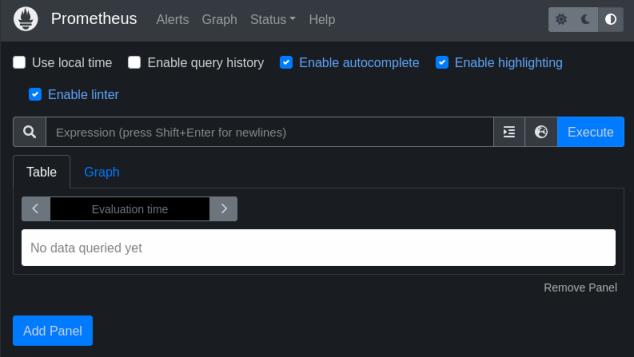
Prometheusの管理画面にアクセスしてみましょう。tcp/9090 で待ち受けていますので、我が家ですと http://UbuntuServer2204:9090 になります。
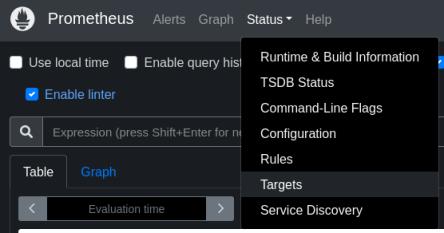
メニューから[Status]-[Targets]と選択します。
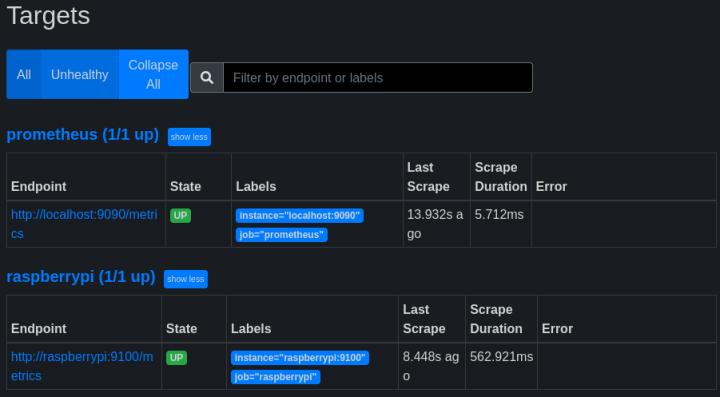
ラズパイが登録されていることが分かります。
これで勝手にラズパイのサーバーメトリクスが Prometheusのデータベースに溜め込まれているはずです。
メトリクスデータを溜めている間に Grafanaの準備をします。
Ubuntu Serverでの作業になります。
Grafanaの前提になっている libfontconfig1 をインストールしておきます。
subro@UbuntuServer2204:~$ sudo apt-get install -y adduser libfontconfig1
パッケージリストを読み込んでいます... 完了

〜〜〜 中略 〜〜〜

No VM guests are running outdated hypervisor (qemu) binaries on this host.
インストールできました。
Grafanaのサイトからパッケージをダウンロードします。
subro@UbuntuServer2204:~$ wget https://dl.grafana.com/oss/release/grafana_9.2.3_amd64.deb
--2022-11-07 13:52:31--  https://dl.grafana.com/oss/release/grafana_9.2.3_amd64.deb

〜〜〜 中略 〜〜〜

2022-11-07 13:54:08 (974 KB/s) - ‘grafana_9.2.3_amd64.deb’ へ保存完了 [96366754/96366754]
2022年11月7日時点の最新版は、9.2.3でした。
ダウンロードできました。
インストールします。
subro@UbuntuServer2204:~$ sudo dpkg -i grafana_9.2.3_amd64.deb
以前に未選択のパッケージ grafana を選択しています。

〜〜〜 中略 〜〜〜

 sudo /bin/systemctl start grafana-server
インストールできました。
systemdのユニットファイルは書かれていますが自動起動の設定はされていませんので、ユニットファイルを自動起動の対象にしてから手動起動しておきます。
subro@UbuntuServer2204:~$ sudo /bin/systemctl enable grafana-server
Synchronizing state of grafana-server.service with SysV service script with /lib/systemd/systemd-sysv-install.
Executing: /lib/systemd/systemd-sysv-install enable grafana-server
Created symlink /etc/systemd/system/multi-user.target.wants/grafana-server.service → /lib/systemd/system/grafana-server.service.

subro@UbuntuServer2204:~$ sudo /bin/systemctl start grafana-server
これで起動して 3000/tcp(http)で待ち受けているはずです。
私の家の環境だと https://UbuntuServer2204:3000 になりますので Webブラウザでアクセスしてみます。
このログイン画面が出ますので、初期ユーザー/パスワードの「admin/admin」でLog inを押します。

adminユーザーのパスワード変更を促されますので、両方新しいパスワードを入れて、Submitを押します。

adminユーザーのダッシュボードになります。

まずはデータソースに Pometheusを足しましょう。
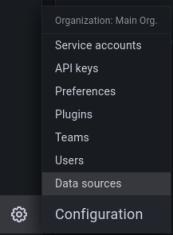
画面左下の歯車アイコンをポイントするとメニューが出ますので[Data Sources]を選択します。
Add data sourceを押します。

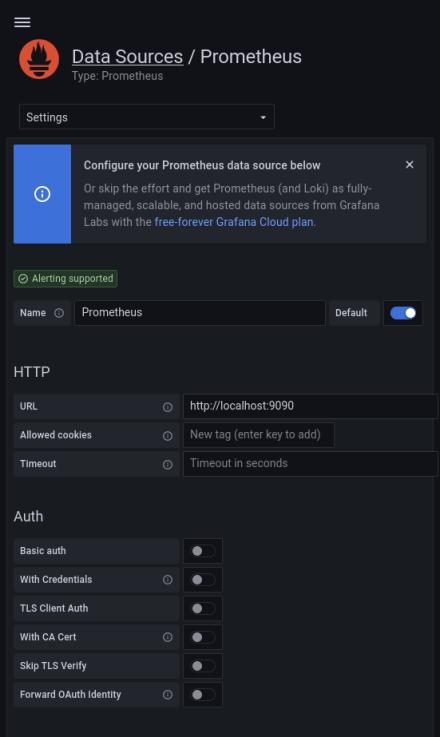
[Ptometheus]をクリックします。

Prometheusのアクセス先 URLだけ入れます。
同じサーバーで動いていますので http://localhost:9090 にしました。
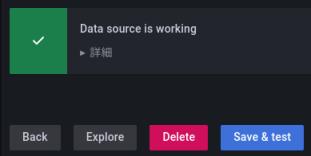
一番下にあるsave & testを押します。
上手く行くと[Data source is working]となりますので、backを押します。
ダッシュボードは1から作っても良いのですが、node_expoterの場合はデザインに長けた何処かの人が作ったカッコイイのが既にありますので、それを利用してみます。
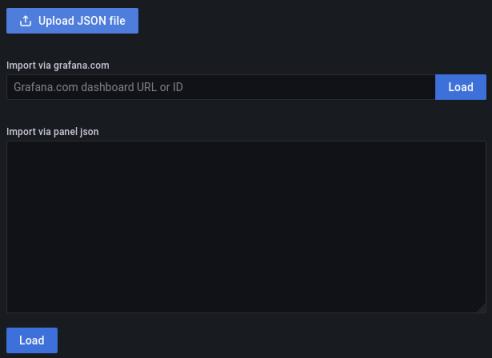
画面右上の田の字のようなアイコンをポイントするとメニューが出ますので、[Import]を選択します。
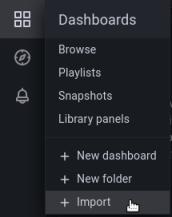
このような画面になります。
ダッシュボードデータのあるURLを指し示すとダウンロードしてくれます。
node_dxporterのダッシュボードデータは以下にありました。
Node Exporter Full
上記のサイトにこの箇所がありますので、Copy ID to clipboardを押してインポート用のIDをコピーします。
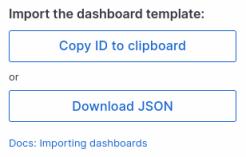
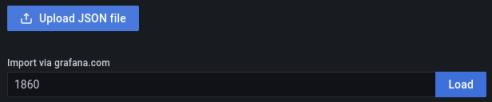
具体的には 1860 という文字列が取られていました。
これを[import from grafana.com]に貼り付けて、Loadを押します。
「Node Exporter Full」の内容が取れているようですので、[Prometheus]のリストから先程作ったデータソース(ここでは default)を選択します。
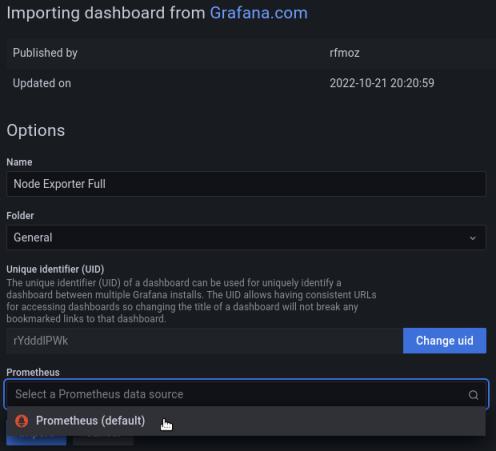
Importを押します。
ちょっと最後だけ大きな画像にさせてもらいました。
ついにラズパイのサーバーメトリクスを見える化することができました。\(^o^)/
とてもラズパイ用の画面とは思えぬwwww
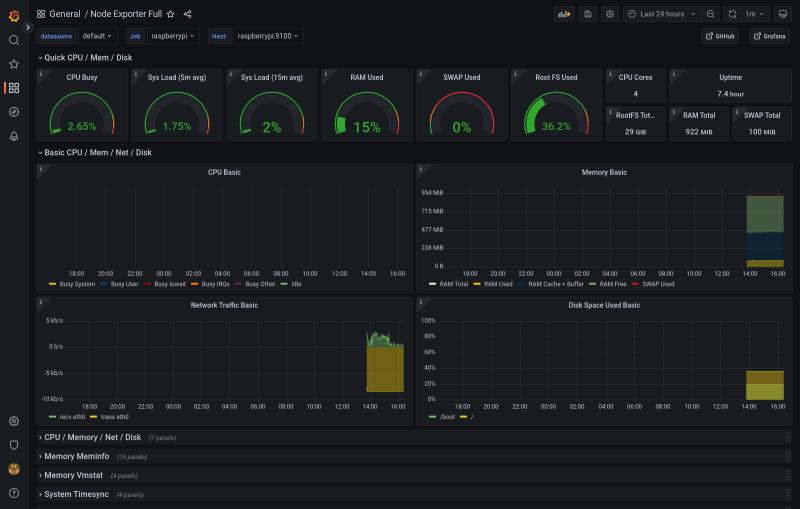
これでやっと負荷を目で見ながらラズパイには辛い仕事をさせることができます。
今回はラズベリーパイを監視対象としましたが、相手が普通の Linuxでも Windowsでも手順は同じです。
Prometheusと Grafanaでのサーバーメトリクスの取得と見える化の典型的な環境構築の方法になっていると思います。
Grafanaのダッシュボード作りはつい力が入ってしまって、いつの間にか時間がかかってしまうものですが、すでに多くのデザインが世に出ています。
最初は自前のものを作るにしても、既にあるものをパクった上で自分なりにカスタマイズしていくのが一番分かりやすくて速いと思います。
大型のモニタをいくつも並べてグラフ表示させるとカッコイイと思います。
(自宅でそんなことはできようはずもなく…)